Equities Remain Strong Despite Traditionally Weak September
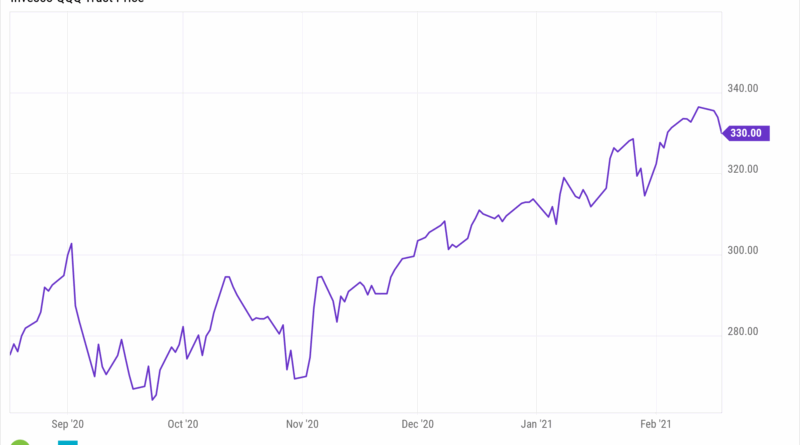
This has proven to be another strong week for equities, despite historical trends suggesting September should be a weak month for the stock market averages. To date, the SPDR S&P 500 (SPY) has grown by 2.1% this month, while the Invesco QQQ Trust (QQQ) is showing an increase of 2.9%.
The S&P 500 and the Dow Industrial Average continue to reach new record highs, with most stock market averages having attained their annual R1 pivot resistance in the preceding month. The NYSE Composite, which is a broad market average, has been trading above its annual R1 at 20,903 for most of September, reaching a peak in the last week at 21,056.
The yearly R2 at 22,252 is situated 4.1% above the closing figure. As depicted in the daily chart below, there is chart resistance, line a, detected at 21,890 and also the monthly R2. Last week, the R1 at 21,520 was challenged, as was the weekly starc+ band lying at 22,052.
The NYSE All Advance/Decline line finished its corrective phase in May, surpassing the resistance at line b, while making a new peak at point c. The other A/D lines effectively validated this activity. However, there was a shift in market behavior in August as the NYSE All A/D line started to surge, making convincing new highs towards the end of August.
The upward trajectory of the NYSE All A/D line continued in September and reached new heights at last week’s end. Interestingly, this market behavior did not align with the most recent report from the AAII. According to their report, 49.5% of participants were pessimistic about stocks for the subsequent six months, compared to a mere 28% who held a bullish stance.
The report also showed that the percentage of bears exceeded bulls by 21%, indicated by a bull%-bear% reading of -21.2%. It’s worth noting that this occurrence of lower highs, line d, is unusual as averages continue to set new record highs. The reading is slightly above the -30 level that is typically associated with extremely low bullish sentiment and indicative of market bottoms, not peaks.
Last Thursday saw strength in all six of the A/D lines, with the NYSE ratio being over 4:1 positive. However, the market sentiment turned on Friday with the ratio becoming 2:1 negative. For the S&P 500, more than half (54%) of the stocks recorded a drop for the day, while 65% of the S&P 1500 ended the day lower, with 38% of the NDX100 stock also closing with a decrease in value.
Consequently, the daily NDX100, Russell 2000, and Dow Industrial A/D lines all closed with a negative figure on Friday. Their negative A/D numbers could set a precedent for some of the other indices to follow suit and turn negative, as we head into the next week. The Invesco QQQ Trust (QQQ) however, managed to rise by 1.8% over the week, surpassing its August high of $583.32.
The completion of the trading range from 583.32 to 551.56 implies a projected move towards the $615 target area. Last week saw the yearly R1 at $572.08 convincingly conquered, with an eye now on the R2 at $626.93. Another positive indication is the 20-day EMA at $575.55, which is again on the rise, with stronger chart support resonating from June at $536.20.
The NDX100 A/D line had reached its peak on July 25th, as denoted by line a, and has since been depicting lower highs. As a result, it closed below its WMA on Friday, with pivotal support at line b. Any fall below this level could suggest an impending deeper correction.
The daily relative performance (RS) seems to have established a short term bottom, as it has started to incline after validating its WMA. This aligns with the increase seen in the IWF/IWD ratio which also indicates growth. This ratio had broke out to the upside in July, underwent a retest during August, and then started moving higher.
Presently, the sector presents a nuanced picture, with certain conflicting indicators. While the NYSE All A/D line has shown a breakout towards the upside, the S&P 500 and NDX100 A/D lines are still within their respective ranges. In July, the BofA Global Research fund manager’s survey saw cash levels drop to 3.9%, a trend usually observed prior to a market decline.
This figure hit a 15-year low in February at 3.5%, resulting in a significant market drop. An increase to the levels of 4.3-4.5% would be seen as an encouraging sign, as it reached this level back in May when the market correction concluded. Expectations are for the release of new data in the coming week.
In terms of strategy, adhering to the trend analysis of the daily advance/decline lines could provide early signals about potential severe stock market corrections. Monitoring the direction of the trend could be instrumental in strategic decision-making, offering insights into potential market shifts.